
Where are the Real Opportunities in Coretech Ecosystems for Insurtechs?
Where are the real opportunities for insurtechs in coretech ecosystems?
Not in saturated market segments.
And not in “empty” ecosystem gaps.
Sounds obvious — but identifying which is which isn’t.
We analyzed 177 capabilities across 600+ partners and 39 ecosystems to uncover where buyer demand and competitive pressure signal opportunity.
Executive Summary
New insurtechs that plan to go to market through coretech ecosystems are immediately confronted with the question, “Which market segments offer real opportunities?”
Answering this question accurately is essential. Get it wrong, and an insurtech may land in a segment saturated with dozens of competitors. Or, it may fall into a dormant market niche years away from significant adoption.
We analyzed 177 capabilities offered by over 600 partners across 39 P&C core platform ecosystems. Our review uncovered clear patterns that help identify market opportunities based on partner density and ecosystem adoption. Using these patterns, we’ve developed an opportunity matrix with four quadrants that illustrate how a balance between buyer demand and competitor interest signals opportunities.
The most attractive opportunities are found in areas where a demand signal has emerged, but competition is still forming — particularly within the “Emerging Standards” quadrant and select categories within the “Contested” quadrant.
For new insurtechs, success depends on recognizing not just where gaps exist, but where those gaps reflect real, growing demand within coretech ecosystems.
Analysis
In our recent research articles on P&C core platform ecosystems, we identified “Top 10” capabilities (see: Mapping the P&C Coretech Ecosystem: 177 Capabilities that Shape Ecosystem Coverage and Fit) and “Top 50” partners (see: Top 50 P&C Coretech Ecosystem Partners: Structural Areas of Focus) that are becoming de facto standards.
For core platform providers, these top partners and capabilities provide a useful reference for planning and growing their partner ecosystems. However, for insurtech startups and new market entrants who seek to become ecosystem partners themselves, the Top 50 represent market segments with limited opportunities. Unless a startup has strong differentiation, it will be difficult to break in and compete against several, sometimes dozens, of established players.
If these crowded segments should be avoided by insurtech startups, the next question, naturally, is “Which market segments have the real opportunities?”
The answer is not as simple as finding gaps in ecosystem coverage. Many apparent gaps reflect segments with little potential for new insurtechs:
Capabilities already embedded within core platforms
Capabilities delivered by horizontal, industry-agnostic tech providers
Highly specialized or niche markets dominated by entrenched providers
To obtain a clearer picture of market opportunities, ecosystem capabilities should be viewed using two dimensions. Across the 177 capabilities we’ve covered in our research, clear patterns emerge when we map the number of partners that provide a capability against the number and size of the ecosystems in which that capability appears. Applying these two dimensions – partner density and ecosystem adoption – to our dataset of 600+ partners yields a matrix that begins to reveal opportunities, as shown in Figure 1 below.
Note: This matrix does not measure technology maturity, nor does it represent total market activity, including activity outside P&C insurance. Instead, it reflects partner density and ecosystem adoption based on publicly announced integrations and prioritization within P&C coretech ecosystems. Some capabilities may appear over- or under-represented in comparison with broader, cross-industry activity.
Figure 1. P&C Coretech Ecosystem Opportunity Matrix
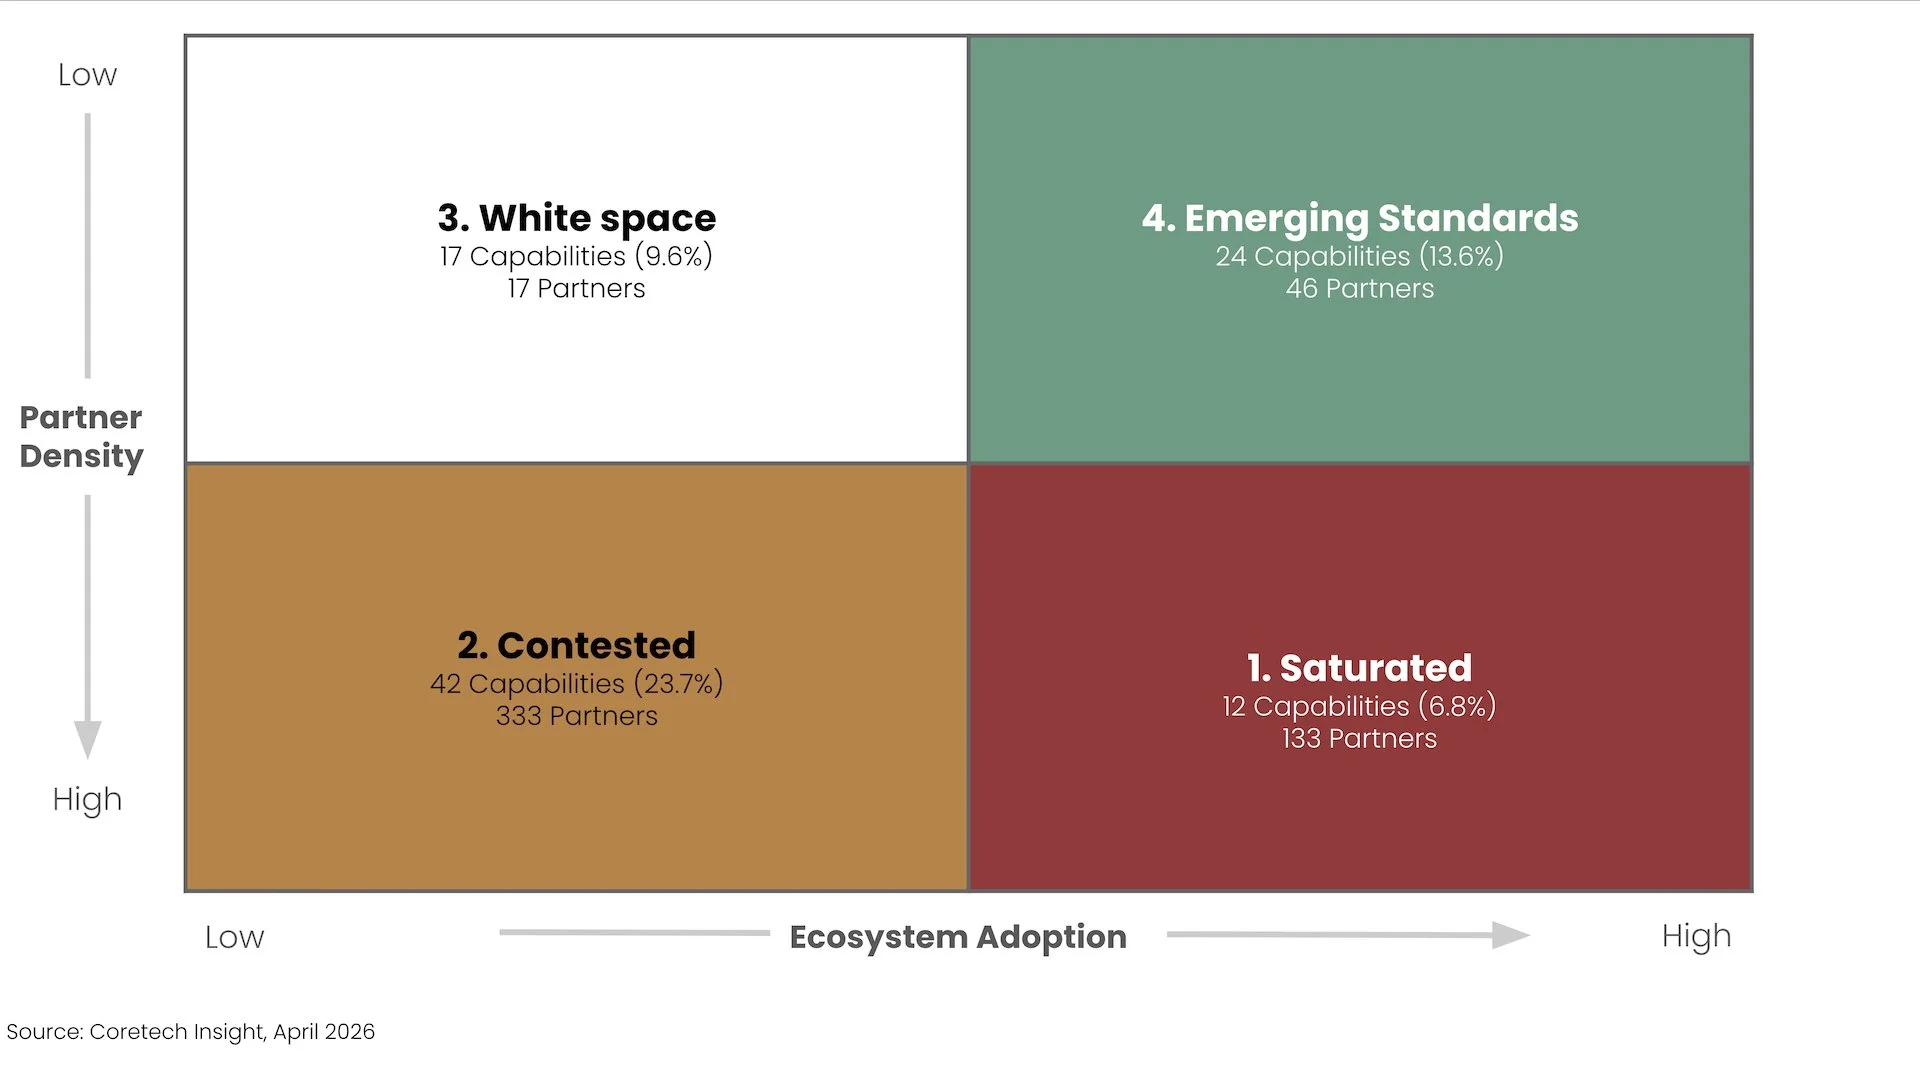
Figure 2 below shows the distribution of ecosystem capabilities across this matrix. The smallest, at just under 7%, are capabilities in the Saturated quadrant, which offer limited opportunities for new insurtechs. The largest, by far, is the Contested quadrant, at nearly 24%. Contested capabilities offer more potential opportunities and more competition. White Space (9.6%) and Emerging Standards (13.6%) round out the four quadrants.
Figure 2. Ecosystem Opportunity Quadrants and Capability Percentages
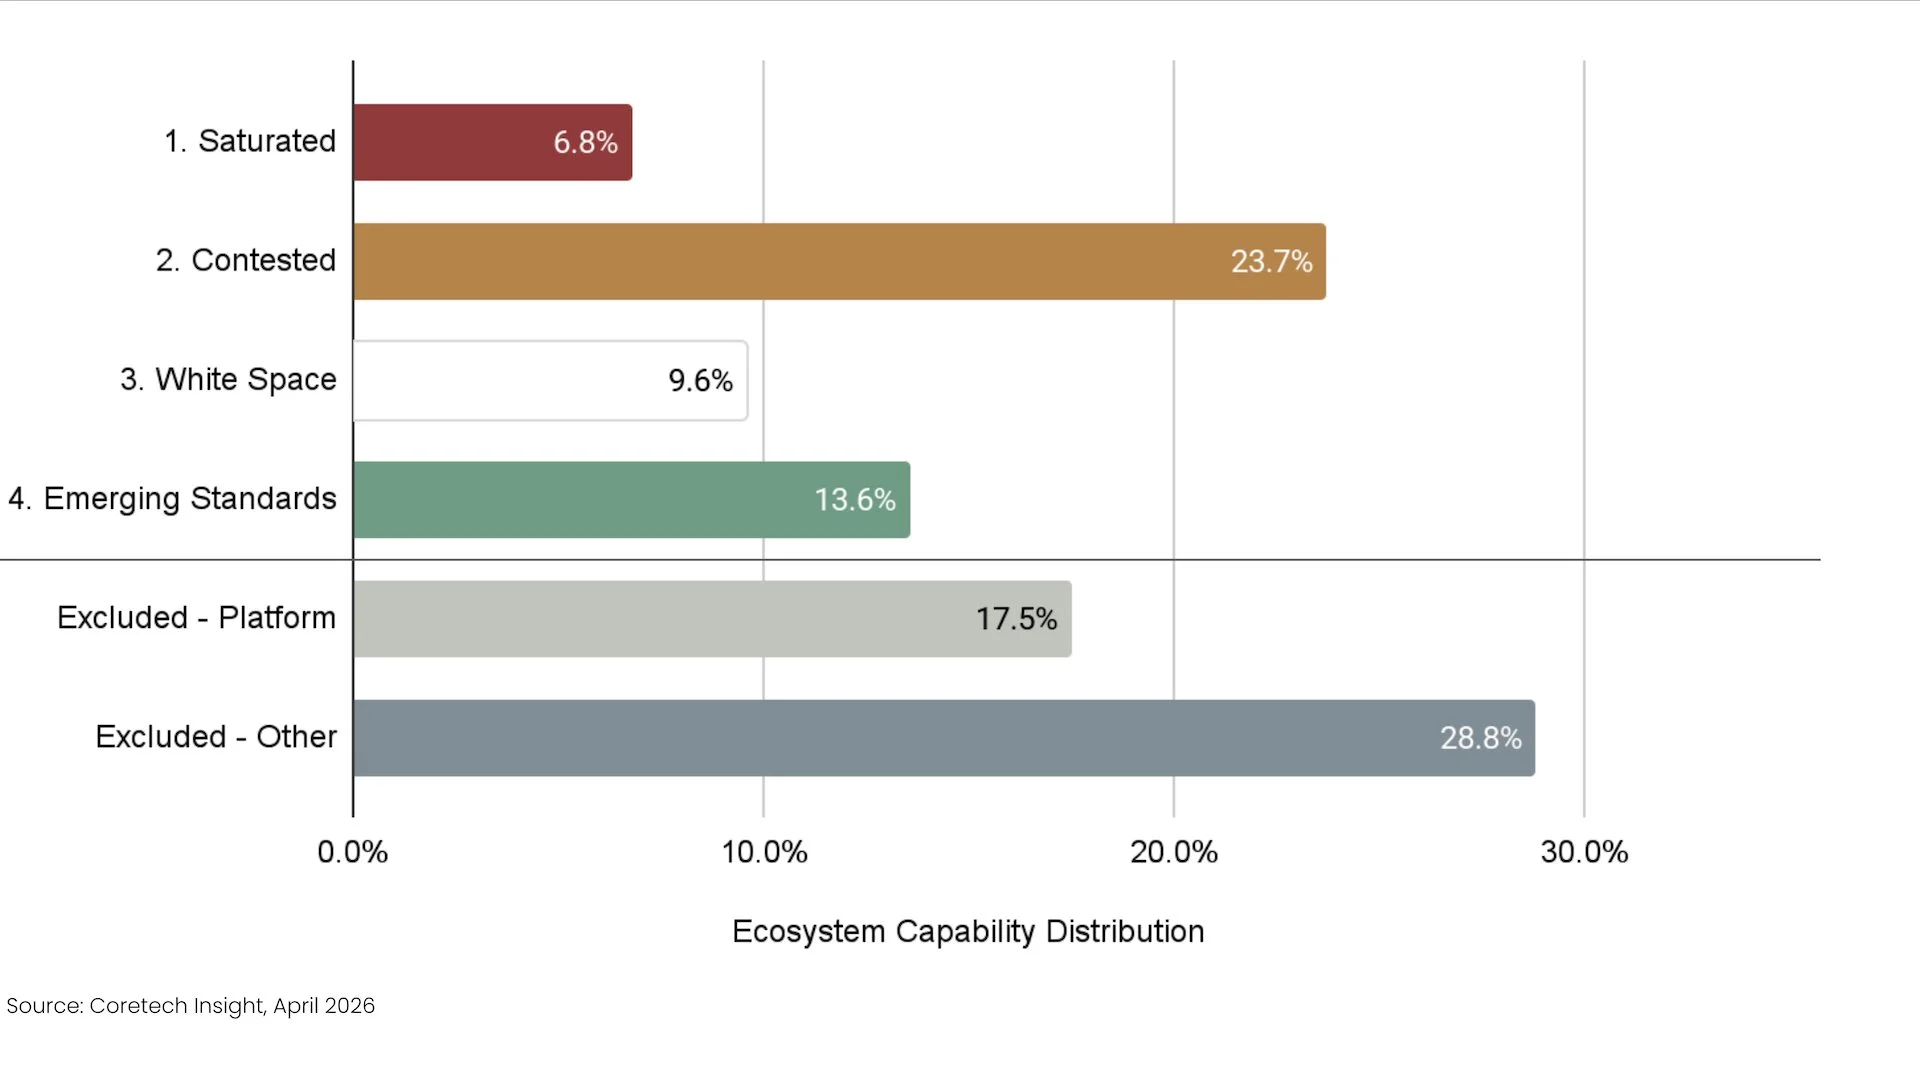
Figure 2 also shows that nearly 1/2 of the 177 capabilities have been excluded because they are structurally limited as ecosystem opportunities for new market entrants. These excluded capabilities have a roughly 40/60 split, with just over 40% closely related to core capabilities that are nearly always embedded in underlying platforms. The other nearly 60% of excluded capabilities (shown as “Excluded - Other”) include horizontal or industry-agnostic technologies, highly specialized services, and mature market segments dominated by entrenched incumbents.

Beginning with the lower-right of the opportunity matrix in Figure 1, Quadrant 1 — Saturated, we find that nearly 7% of ecosystem capabilities fall into this quadrant. These capabilities are becoming ubiquitous and have attracted many partners, which makes differentiation challenging for new market entrants. Table 1 below shows three examples: property & location data, payments, and intelligent document processing.
Table 1. Sample Ecosystem Capabilities: Quadrant 1 - Saturated
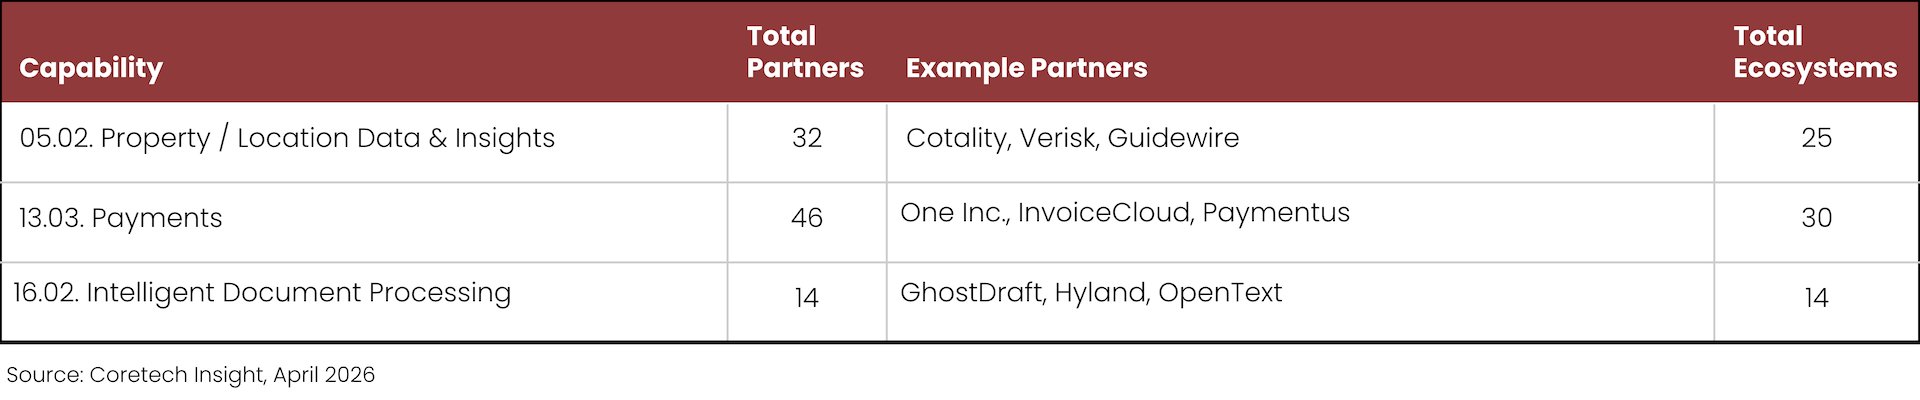
Most of the saturated capabilities feature several highly competitive partners. Not all saturated capabilities have many partners, though. Some have fewer partners, but are mature, service-driven markets dominated by a small number of highly specialized providers with deep regulatory and actuarial expertise. Others, such as intelligent document processing, overlap with functional capabilities often embedded in core platforms, which reduces the total number of potential partnership opportunities.

The second quadrant, Contested, includes capabilities with moderate-to-high partner counts that appear in multiple ecosystems. These capabilities show strong buyer demand, but also increasing competition from other insurtechs. Table 2 below shows three examples: submissions intake & intake automation, fraud detection & analytics, and agentic automation.
Table 2. Sample Ecosystem Capabilities: Quadrant 2 - Contested
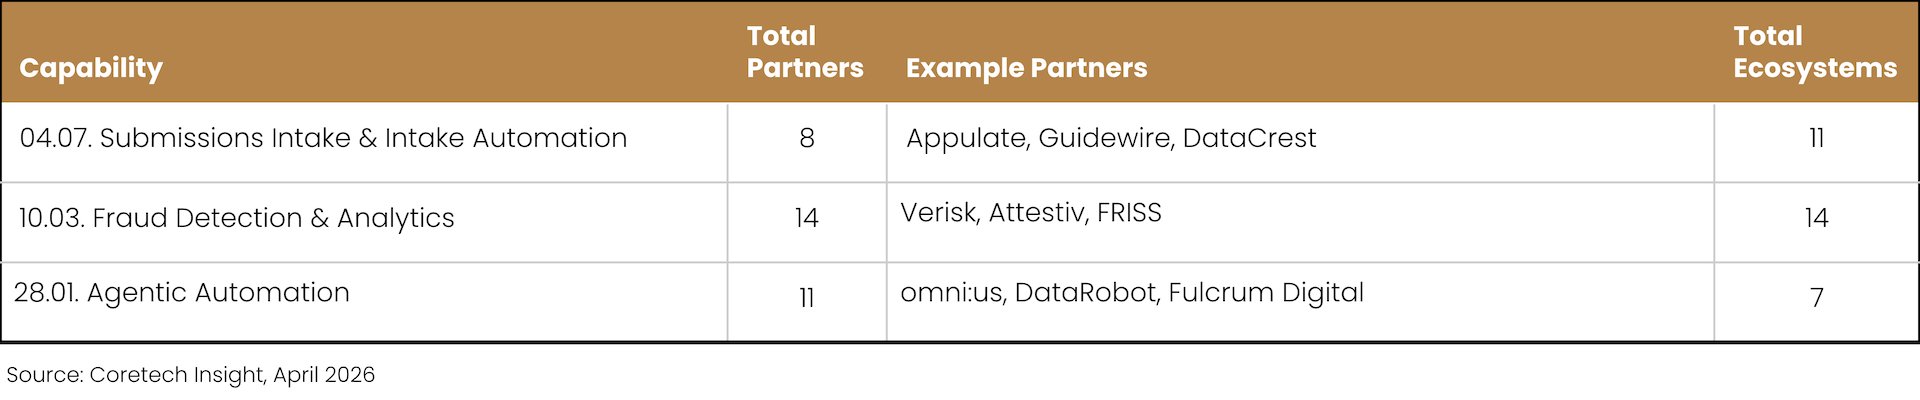
In the Contested quadrant, there is a clear demand for these capabilities, but adoption by coretech ecosystems has been inconsistent. Often, these categories reflect areas where coretech vendors are selectively extending platform capabilities through partners. This quadrant offers opportunities among ecosystems with slower adoption, but incumbent partners with existing integrations have a clear advantage over newcomers.
For some fast-moving Contested capabilities, ecosystem partner listings aren’t keeping up with market activity due to the lag from formal partnership processes. Agentic Automation is a good example of how formal listings may lag and understate competition. In this case, there is significant vendor proliferation — dozens of early-stage startups — beyond formally announced coretech partners. Competition in Agentic Automation is much higher than formal partner counts suggest.

White Space – the third, upper-left quadrant in Figure 1 – includes ecosystem capabilities that have made it “on the board” with at least one partner, but with only limited adoption across the coretech ecosystems. These capabilities appear to offer untapped opportunities, but low ecosystem adoption may be a sign of limited/niche demand, structural constraints, or early-stage challenges. Table 3 below shows three examples: insurance middleware, emerging financial tech, and legacy modernization platforms.
Table 3. Sample Ecosystem Capabilities: Quadrant 3 - White Space
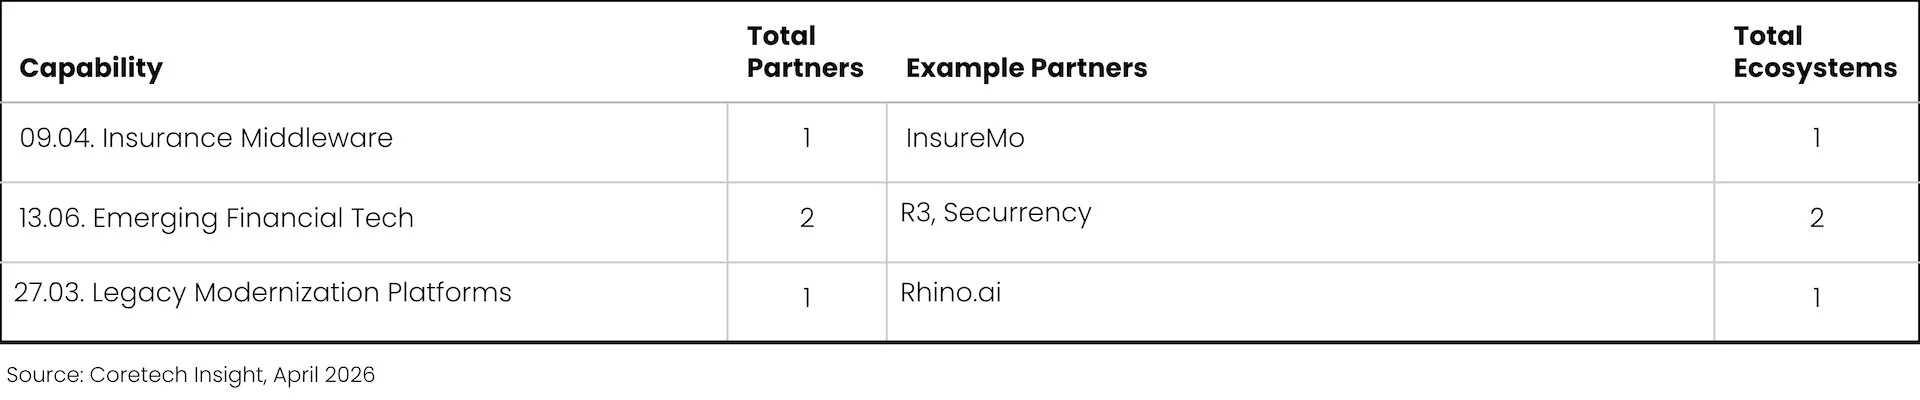
The White Space quadrant is where new technologies and capabilities often make their first appearance in coretech ecosystems. White Space includes a mix of emerging opportunities, structurally underrepresented capabilities, and specialized or niche categories. New market entrants enjoy much less competitive pressure; however, true demand in the form of ecosystem adoption has yet to be proven. Some White Space capabilities will never move beyond niche status to broader adoption.

The last quadrant, Emerging Standards, offers lower partner density plus indicators of buyer interest. These capabilities are often gaining traction by organizing and accelerating previously fragmented or manual processes. The total number of ecosystems is lower, but the individual ecosystems themselves are larger, with greater adoption from large Industry Marketplace ecosystems. Emerging Standards spans multiple dimensions — including data, analytics, workflow extensions, and new architectural layers. (See Table 4 for sample capabilities.)
Table 4. Sample Ecosystem Capabilities: Quadrant 4 - Emerging Standards
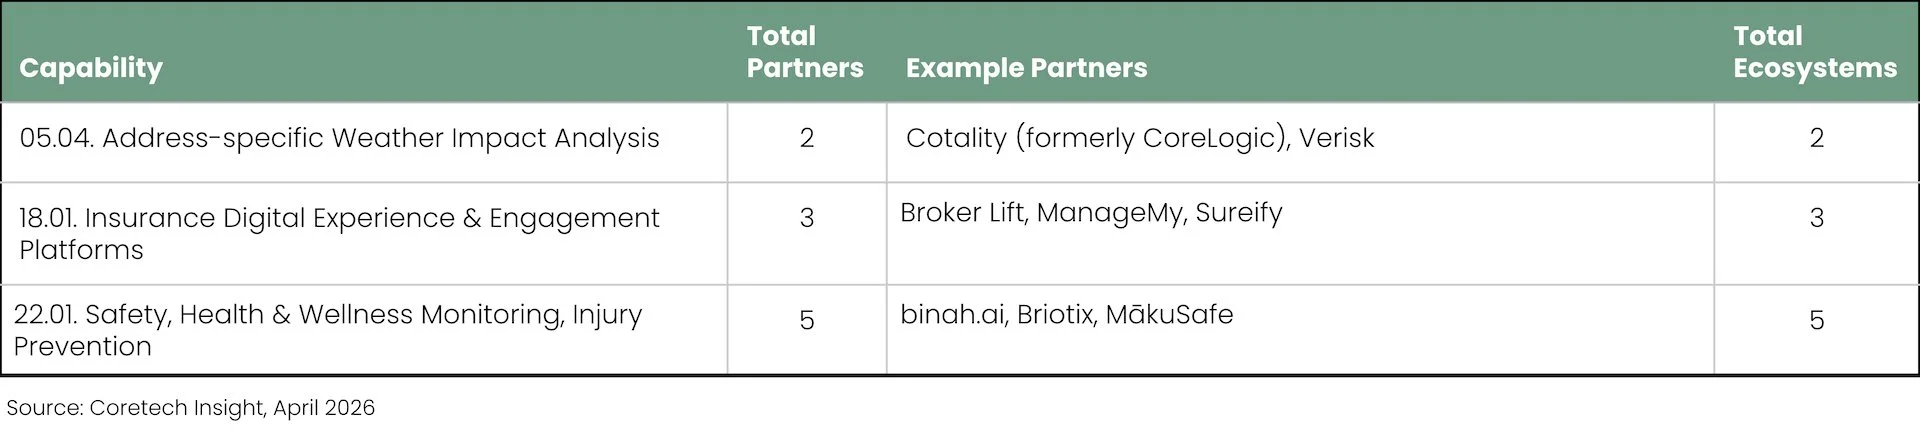
While this quadrant favors emerging technologies, many of these technologies are not new. Several are long-established technologies and capabilities that have only more recently begun to be formalized and integrated with modern coretech ecosystems. Limited, slower adoption often reflects more conservative insurance tech buyers, or an earlier focus by the industry on other priorities.
Application
The Ecosystem Opportunity Matrix shows how, as new insurtechs hunt for market opportunities within P&C coretech ecosystems, there are two mistakes to avoid. The first is confusing interest with opportunity, and pursuing capabilities that have already received significant attention in the industry. These are represented by the Saturated quadrant, and (to a lesser degree) the Contested quadrant, where there is demand and competition from other ecosystem partners that have already responded to the market opportunities.
The second mistake is mistaking gaps for opportunity, and pursuing capability gaps where there are few active ecosystem partners. These capability gaps are represented by the White Space quadrant. While a wide-open field with few competitors may look attractive, the lack of ecosystem partners often reflects a niche market segment that has not seen widespread adoption.
The most promising opportunities balance demand with a smaller, more manageable number of competitors. These opportunities fall within the Emerging Standards quadrant and select capabilities in the Contested quadrant. The Contested quadrant offers the strongest signal of buyer demand, which has also attracted more competitors. The Emerging Standards quadrant has fewer competitors, but demand signals are weaker.
By finding the right balance between buyer demand and competitive pressure — prioritizing capabilities with consistent partner activity that have not yet become overcrowded — new insurtechs can avoid the challenges of both saturated and listless segments and focus on more promising market opportunities.
Recommendations
New Insurtechs:
Target ecosystems and capabilities with validated demand signals. Emerging Standards capabilities offer early signals of buyer interest with fewer competitors, while select Contested capabilities provide stronger demand signals but require greater speed and sharper positioning to compete with incumbents.
Avoid saturated capabilities without clear, defensible differentiation. In high-density domains — such as payments, property data, or document processing — opportunities are limited; new entrants must demonstrate meaningful advantages to compete with established players.
Avoid empty categories that lack buyer demand. Do not assume that gaps in ecosystem coverage represent opportunity. Many low-density capabilities reflect niche markets, embedded platform functionality, or horizontal technologies with limited opportunity.
Align solutions with core insurance workflows and ecosystem architecture. Capabilities that enhance specific underwriting, claims, or other insurance operational workflows are more likely to secure coretech partners and buyers than generic technology solutions that lack a clear insurance context.
For organizations seeking to apply this research — including detailed ecosystem benchmarks, vendor-specific insights and comparisons, and strategic fit assessments — Coretech Insight provides private research reports and executive briefings tailored to buyers, vendors, and ecosystem partners.
To explore a private briefing or customized research engagement, contact Coretech Insight at jeff.haner@coretechinsight.com.
Note 1. Methodology
This article builds on ecosystem research conducted by Coretech Insight in Q4 2025. The research analyzed publicly available ecosystem, partner, and marketplace content for 39 P&C coretech vendors actively marketing in the United States and Canada.
We reviewed ecosystem presentations, partner directories, marketplace listings, and more than 450 press releases announcing technology partnerships over the past 15 years. From this analysis, we catalogued 647 ecosystem partners and developed a structured capability framework comprising 30 first-level categories and 177 second-level capabilities.
Each capability was assessed for coverage based on the presence of at least one publicly announced partner within that capability area. This research is designed to identify structural ecosystem patterns and strategic emphasis — not to audit integration depth, contractual status, production usage, or commercial success.
Important caveats:
This analysis focuses on technology and solution partners. Ecosystem partners were included when they provide integrated technology solutions, applications, or platform extensions typically reflected in partner directories or marketplaces. Professional services firms, system integrators, and implementation partners were not included, as this research evaluates ecosystem capability coverage rather than delivery capacity.
Partnership inclusion reflects vendor-acknowledged relationships. This analysis includes ecosystem partners publicly identified by coretech vendors in press releases, partner directories, or marketplace listings. Some technology providers may independently claim partnerships that are not formally announced by the coretech vendor. Such claims were not included in order to maintain consistent inclusion criteria across vendors.
Public information may be incomplete. Some vendors maintain integration libraries or partner relationships that are not fully disclosed in public materials.
Coverage indicates presence, not quality. A capability is considered “covered” if at least one partner exists in that area. This does not measure integration depth, deployment frequency, revenue contribution, or the maturity of the relationship.
Gaps may be intentional. Missing capabilities often reflect strategic positioning rather than technical limitations. Vendors prioritize ecosystem investment based on target markets, product strategy, and operating model.
This research represents a point-in-time analysis. Ecosystems evolve continuously, with new partnerships announced regularly. While Coretech Insight intends to update and refine this dataset periodically, this analysis reflects publicly available information as of Q4 2025.
Despite these limitations, publicly shared ecosystem content provides a meaningful signal of vendor strategy, partner prioritization, investment in extensibility, and the role ecosystems play in go-to-market execution. This approach enables consistent cross-vendor comparison using a common structural lens.
Jeff Haner is the co-founder of Coretech Insight, an independent advisory firm. He has served in senior IT, advisory, and marketing roles with Deloitte, Oliver Wyman, NJM Insurance Group, Gartner, and BriteCore. While with Gartner, he authored the Magic Quadrant for P&C Core Platforms. Jeff’s experience “on both sides” of the insurance technology table and his ongoing research enable him to offer deep insurance industry knowledge, strategic insights, and hands-on help to take action.
Contact Jeff at jeff.haner@coretechinsight.com