
Four Implementation Patterns for Faster P&C Core System Go-Lives

How does scope impact P&C core system implementation timeframes?
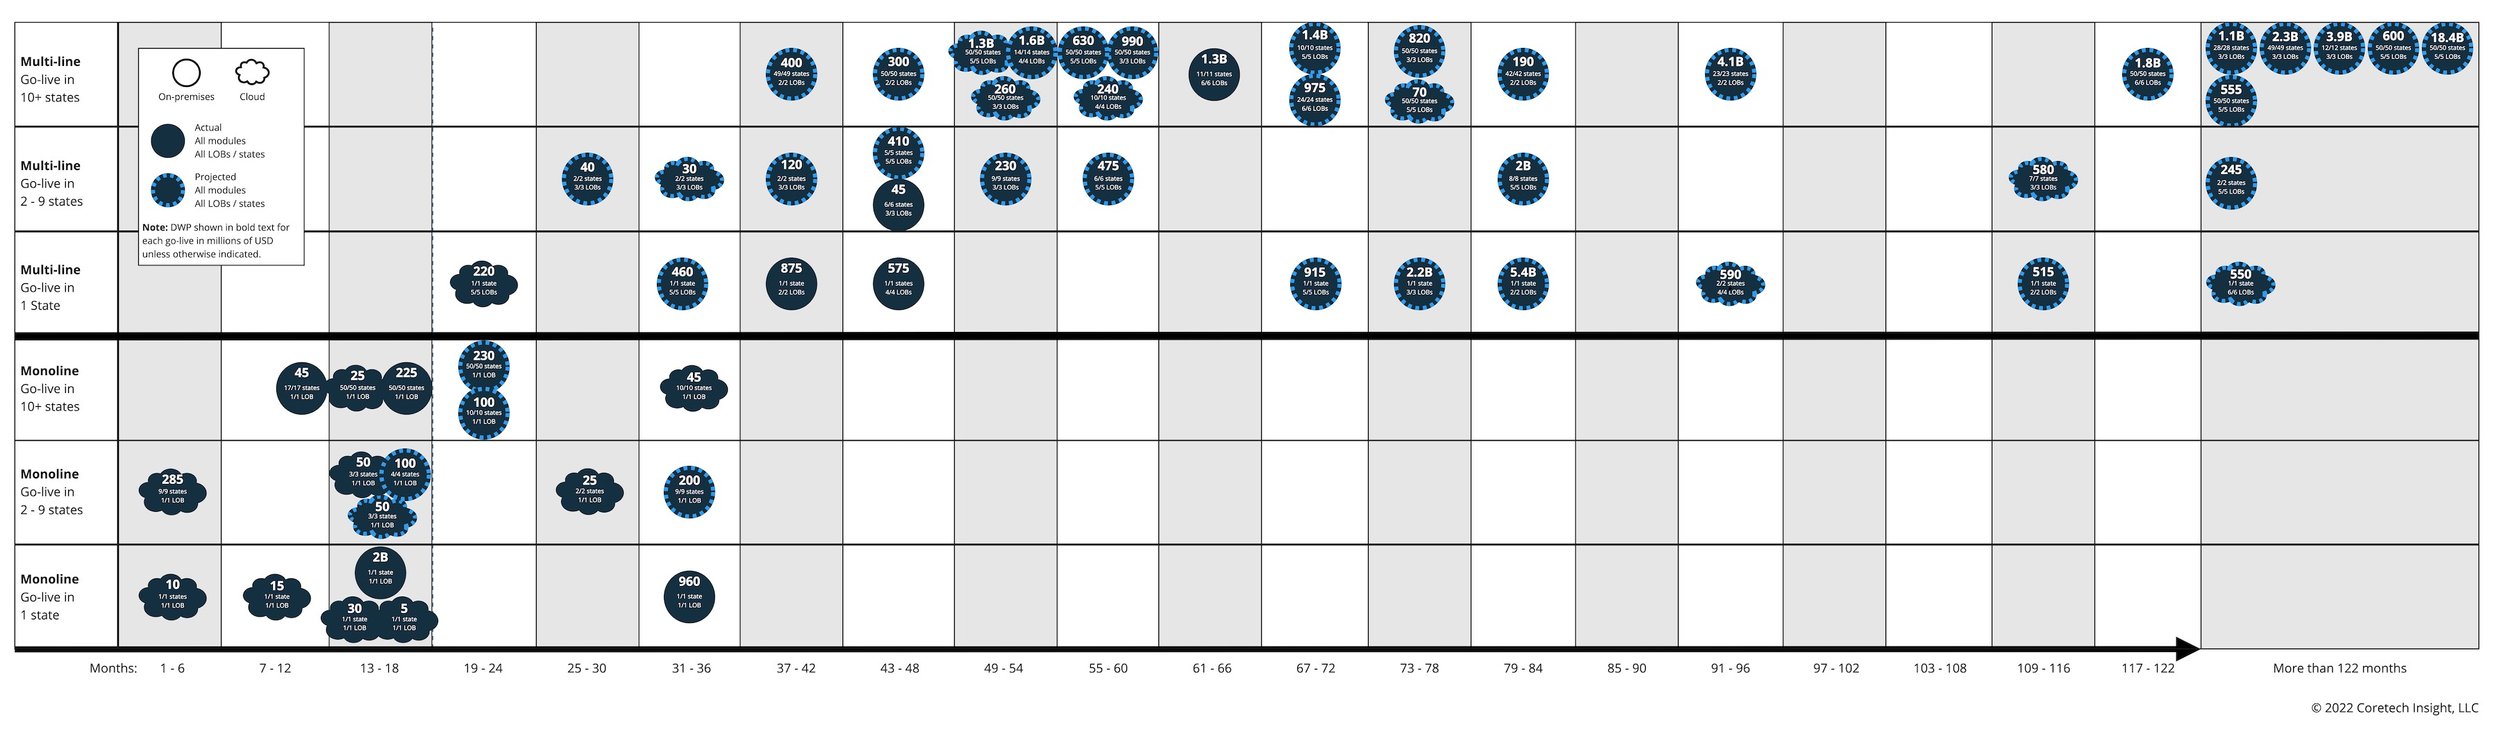
We address this question and map the results of four implementation patterns P&C insurers use to manage scope and achieve faster core system go-lives.
In our last article (see “How Long Do P&C Core System Implementations Really Take?”) we provided a downloadable map of 61 “go-lives” of US and Canadian P&C core systems pulled from a review of 980 press releases from P&C core system vendors active in the US and Canada. This map showed tiers, deployment types, modules, and timeframes from selection to go-live. We showed how there was a correlation between the size of the insurer in DWP and average time to go live that could be used as a general reference to help set expectations for new implementations.
We received an excellent follow-up question about the scope of these go-lives: Were these partial or full deployments? For example, were these go-lives partial deployments with a single line of business (LOB) deployed into a single state, with more LOBs and states to follow in future deployments? Or, were they full deployments covering all LOBs and all states the insurer did business in?
Another way to ask this would be: What was the scope of these go-lives? And, How did scope impact implementation timeframes?
For our prior article and this current piece, we define “go-live” as simply initial use of the system in production. The scope will vary; the key is that at least a portion of the system is being used in production. Some insurers in our review had go-lives that could be considered “full” deployments — they went live with all core modules (policy, billing, and claims), all LOBs, and across all states. Others had go-lives that would fall in the “partial” deployment category — only one or two modules, a subset of LOBs, or a subset of states.
In this article we show how insurers answered these questions about scope for their go-lives — How many modules? How many LOBs? How many states? — through four approaches, or implementation patterns, below.
Implementation Pattern 1
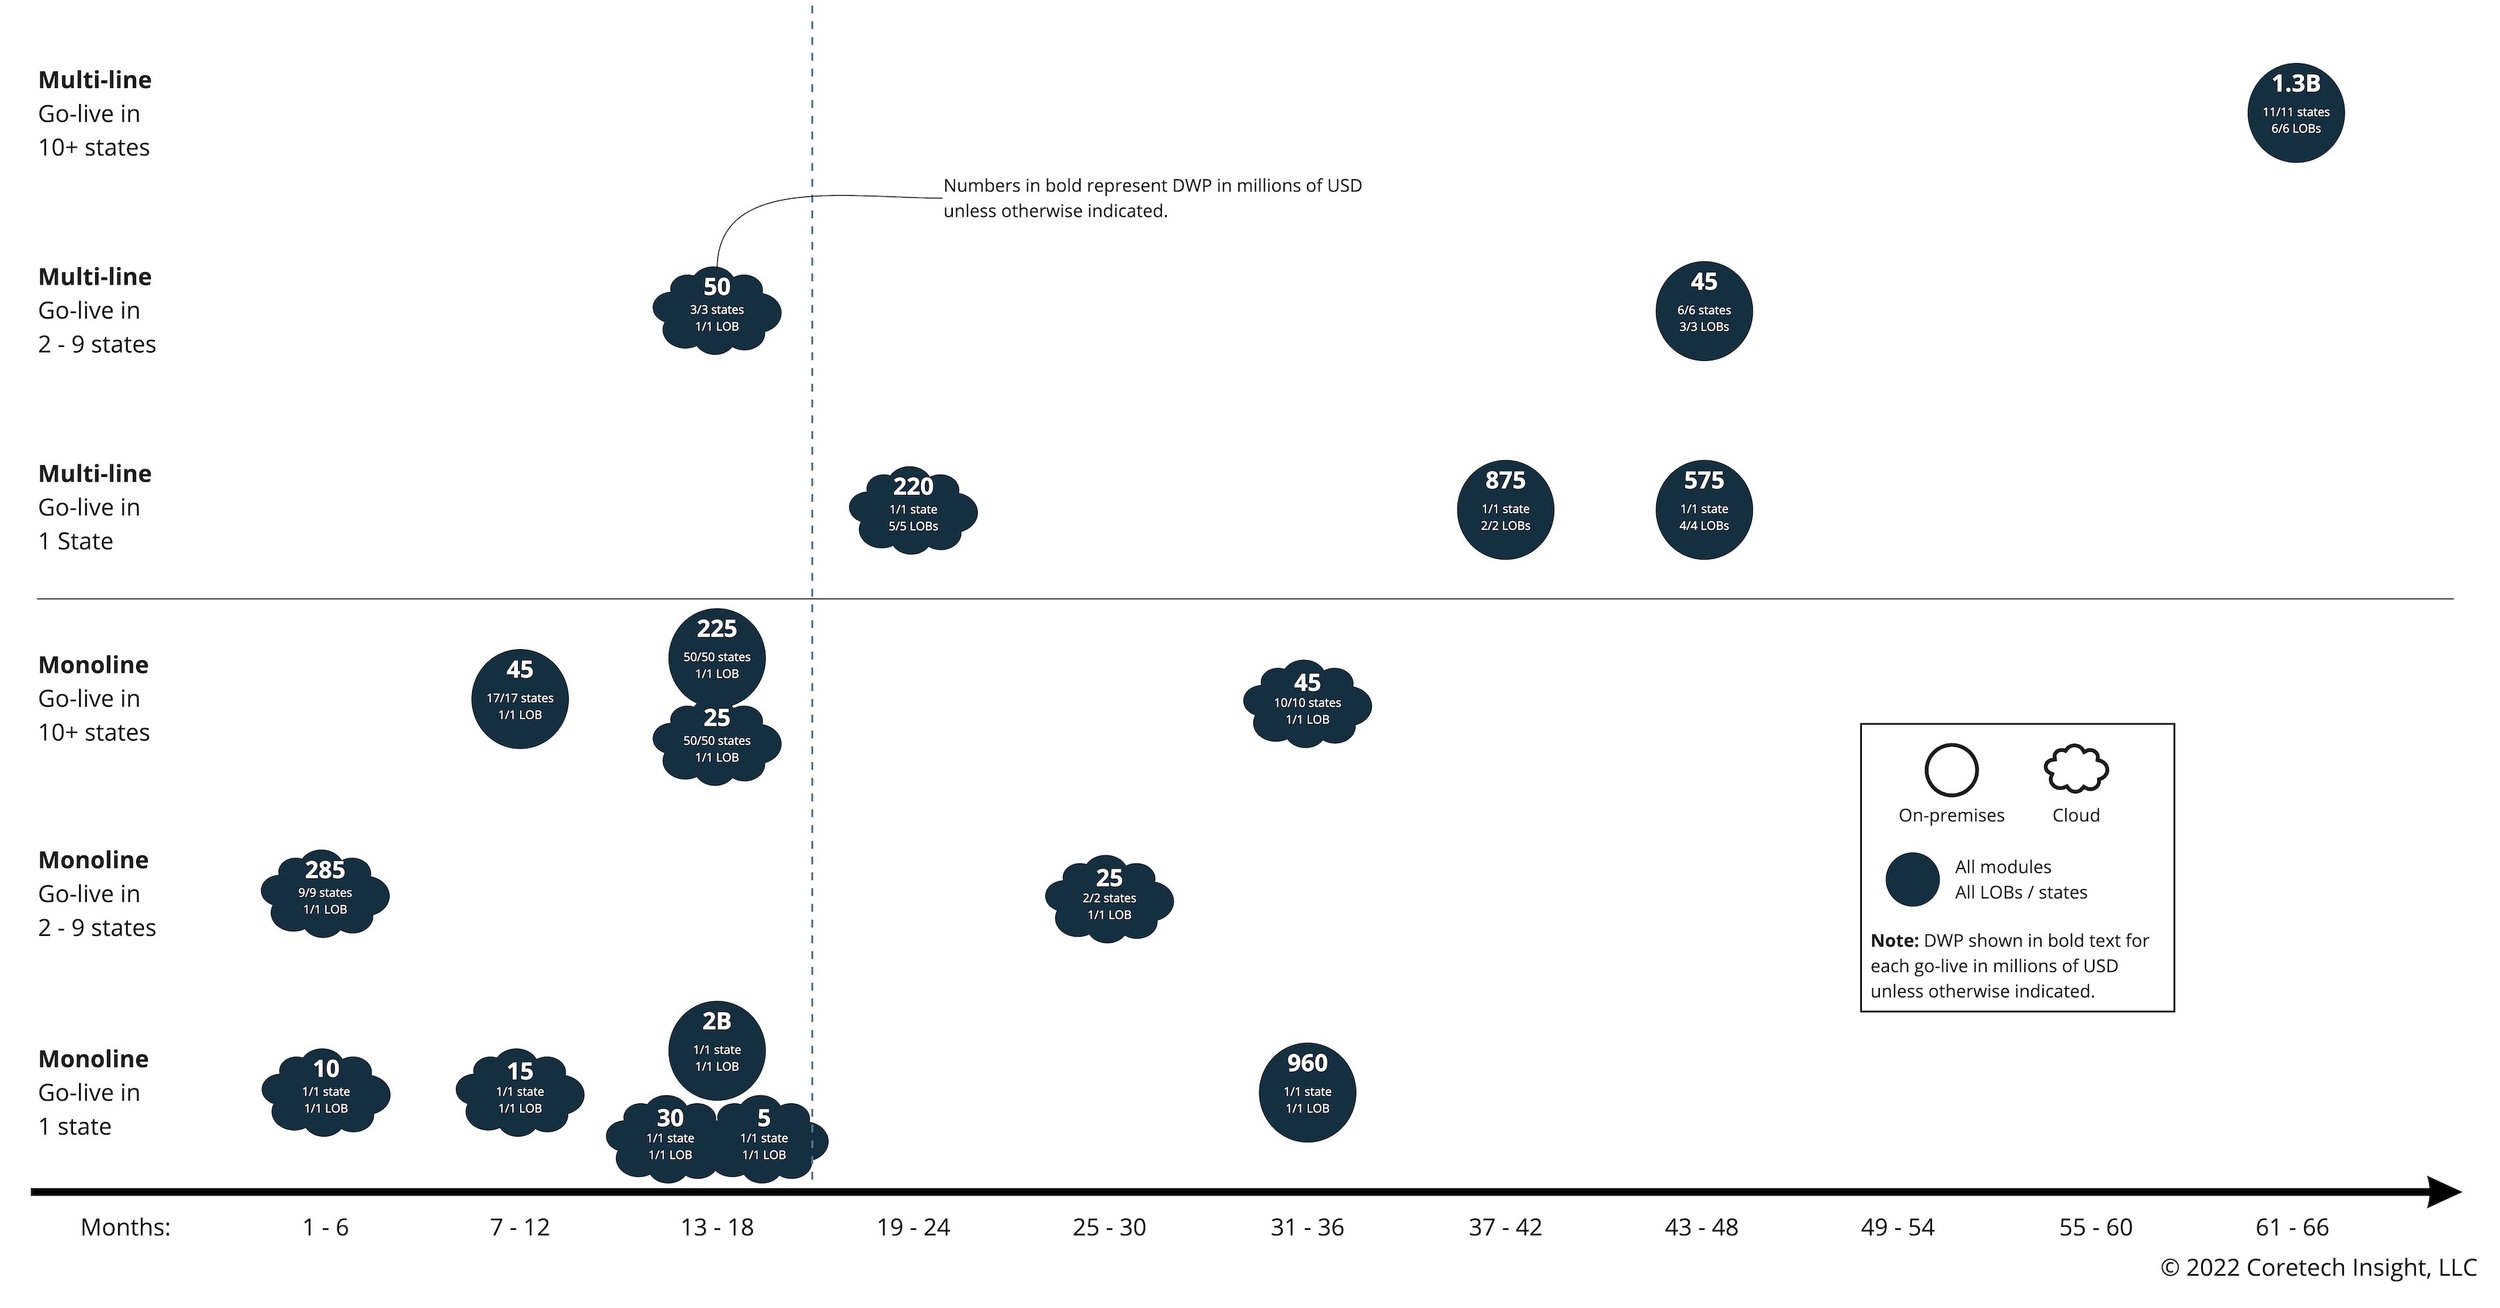
The first implementation pattern was “full deployment” – go-lives with all core modules, supporting all LOBs, across all states the insurer did business in. Out of the 61 go-lives in our review, 18 followed this first pattern. (See Figure 1 – Go-Lives with All Core Modules, LOBs, and States.) Average time from selection to go-live was 24 months. 10 of the 18 went live in under 18 months.
Figure 1. Go-Lives with All Core Modules, LOBs, and States
Source: Coretech Insight, June 2022
(Click image for a downloadable PDF)
Key Characteristics of Rapid Go-Lives
These 10 insurers that went live in under 18 months shared key characteristics that worked in their favor:
Nine of the 10 were monoline insurers – supporting only one LOB, such as nonstandard auto, workers comp, or professional liability.
Seven of 10 were smaller insurers, with $50M DWP or less.
Seven of 10 did business in fewer than 10 states (five in only one state).
Seven of 10 deployed via the cloud.
Factors Driving Extended Timeframes
In comparison to the monoline insurers, the multi-line insurers in Figure 1 above reported significantly longer durations. Only one multi-line insurer completed their full deployment within 18 months. This was a smaller, $50M DWP carrier specializing in a few small commercial lines over three states. As a group, the multi-line insurers required more time (average duration 43 months). They were also larger, and their timeframes correlated with their size and the number of LOBs and states they did business in.
These findings show how scope in the form of DWP, number of modules, number of LOBs, and number of states drive implementation timeframes. The smaller, monoline insurers had a natural advantage with their narrower scope. They were more likely to complete full deployments — all modules with their single LOB across all states — in 18 months. If you’re with a smaller monoline insurer considering a new core system, this is encouraging news!
Alternatives for Achieving Faster Go-Lives
What about large monoline insurers, or multi-line insurers operating in many states or nationwide? If Pattern 1 were the only option, it could seem a foregone conclusion they face at least three or four-year (or more!) timelines for their initial go-lives. However, there are alternatives.
The table below illustrates how the other insurers in this review tackled this problem. (See Table 1. Core System Implementation Patterns.) Implementation Pattern 1 is the approach used by the 18 insurers in Figure 1 above – all three core modules with all LOBs across all states. Most of the other 43 insurers in this review were larger, multi-line, and operated in multiple states. They used one of three alternative implementation patterns - Pattern 2, 3, or 4 below – to reach their initial go-lives in timeframes that were still close to the 24-month average of Pattern 1.
Table 1. Core System Implementation Patterns

Source: Coretech Insight, June 2022
Implementation Pattern 2
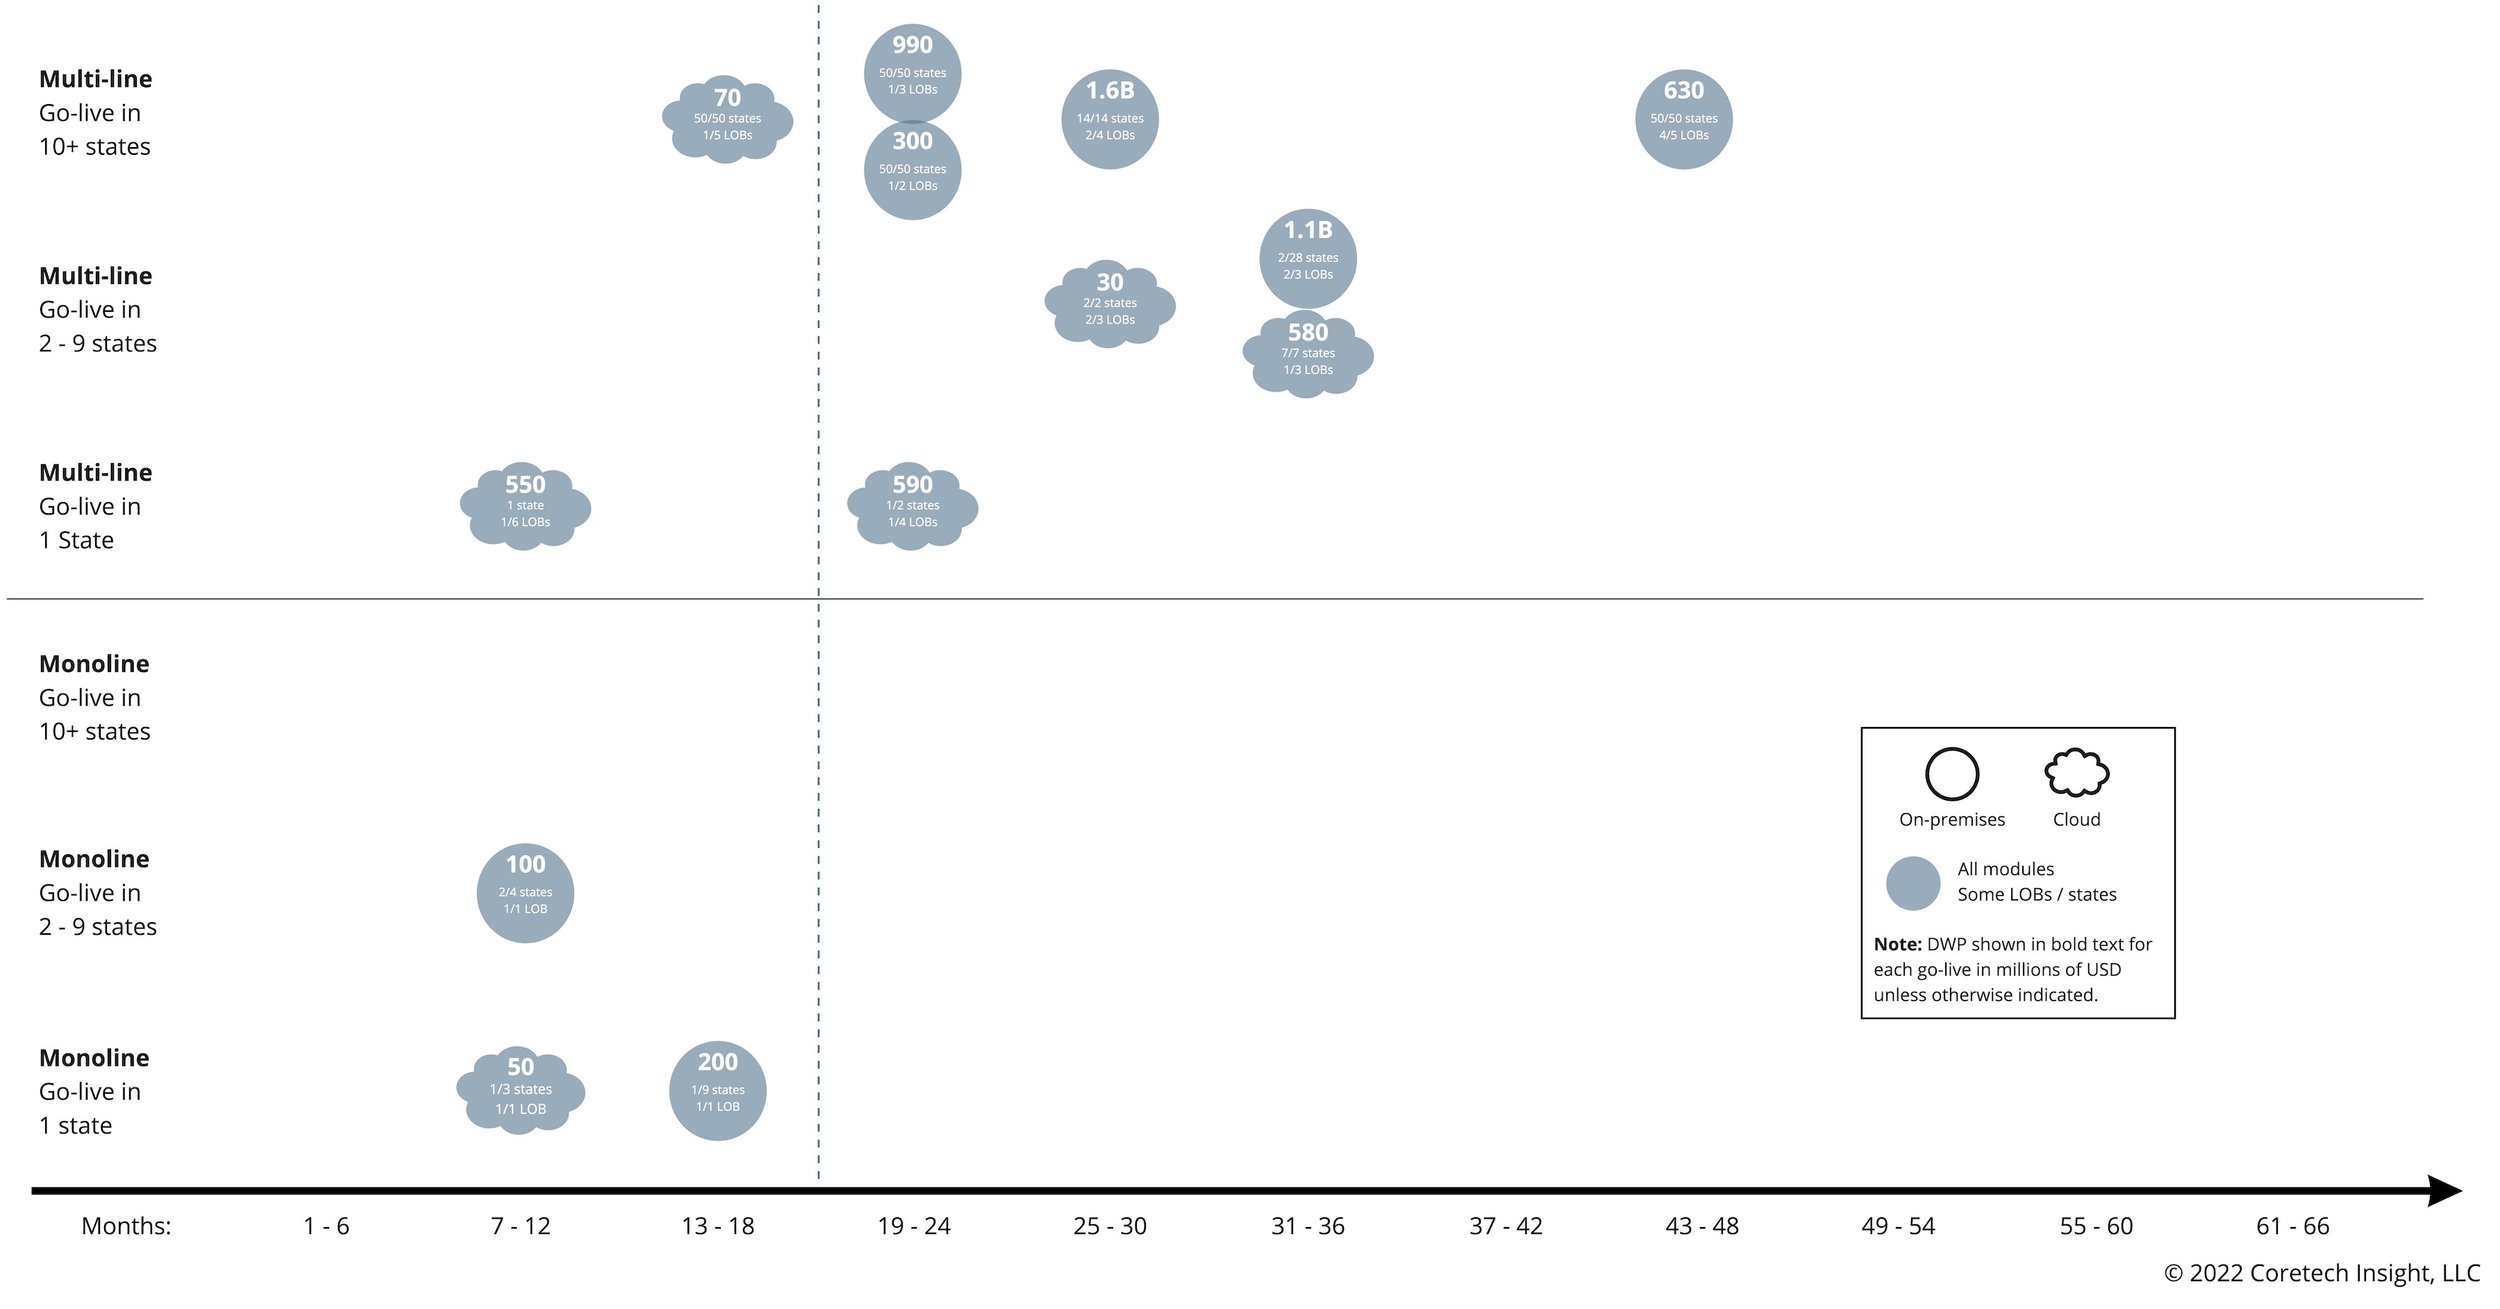
Thirteen insurers used Implementation Pattern 2. (See Figure 2 – Go-Lives with All Modules and Some LOBs and States.) They deployed all three core modules, or an all-in-one platform with policy, billing and claims, but they limited the number of LOBs or states in their go-live.
Figure 2. Go Lives with All Modules and Some LOBs and States
Source: Coretech Insight, June 2022
(Click image for a downloadable PDF)
Among Pattern 2 insurers, the most common approach was to deploy all core modules with a subset of their LOBs across all states. These insurers averaged 22 months to go-live, with five of 13 reaching go-live in under 18 months.
Implementation Pattern 3
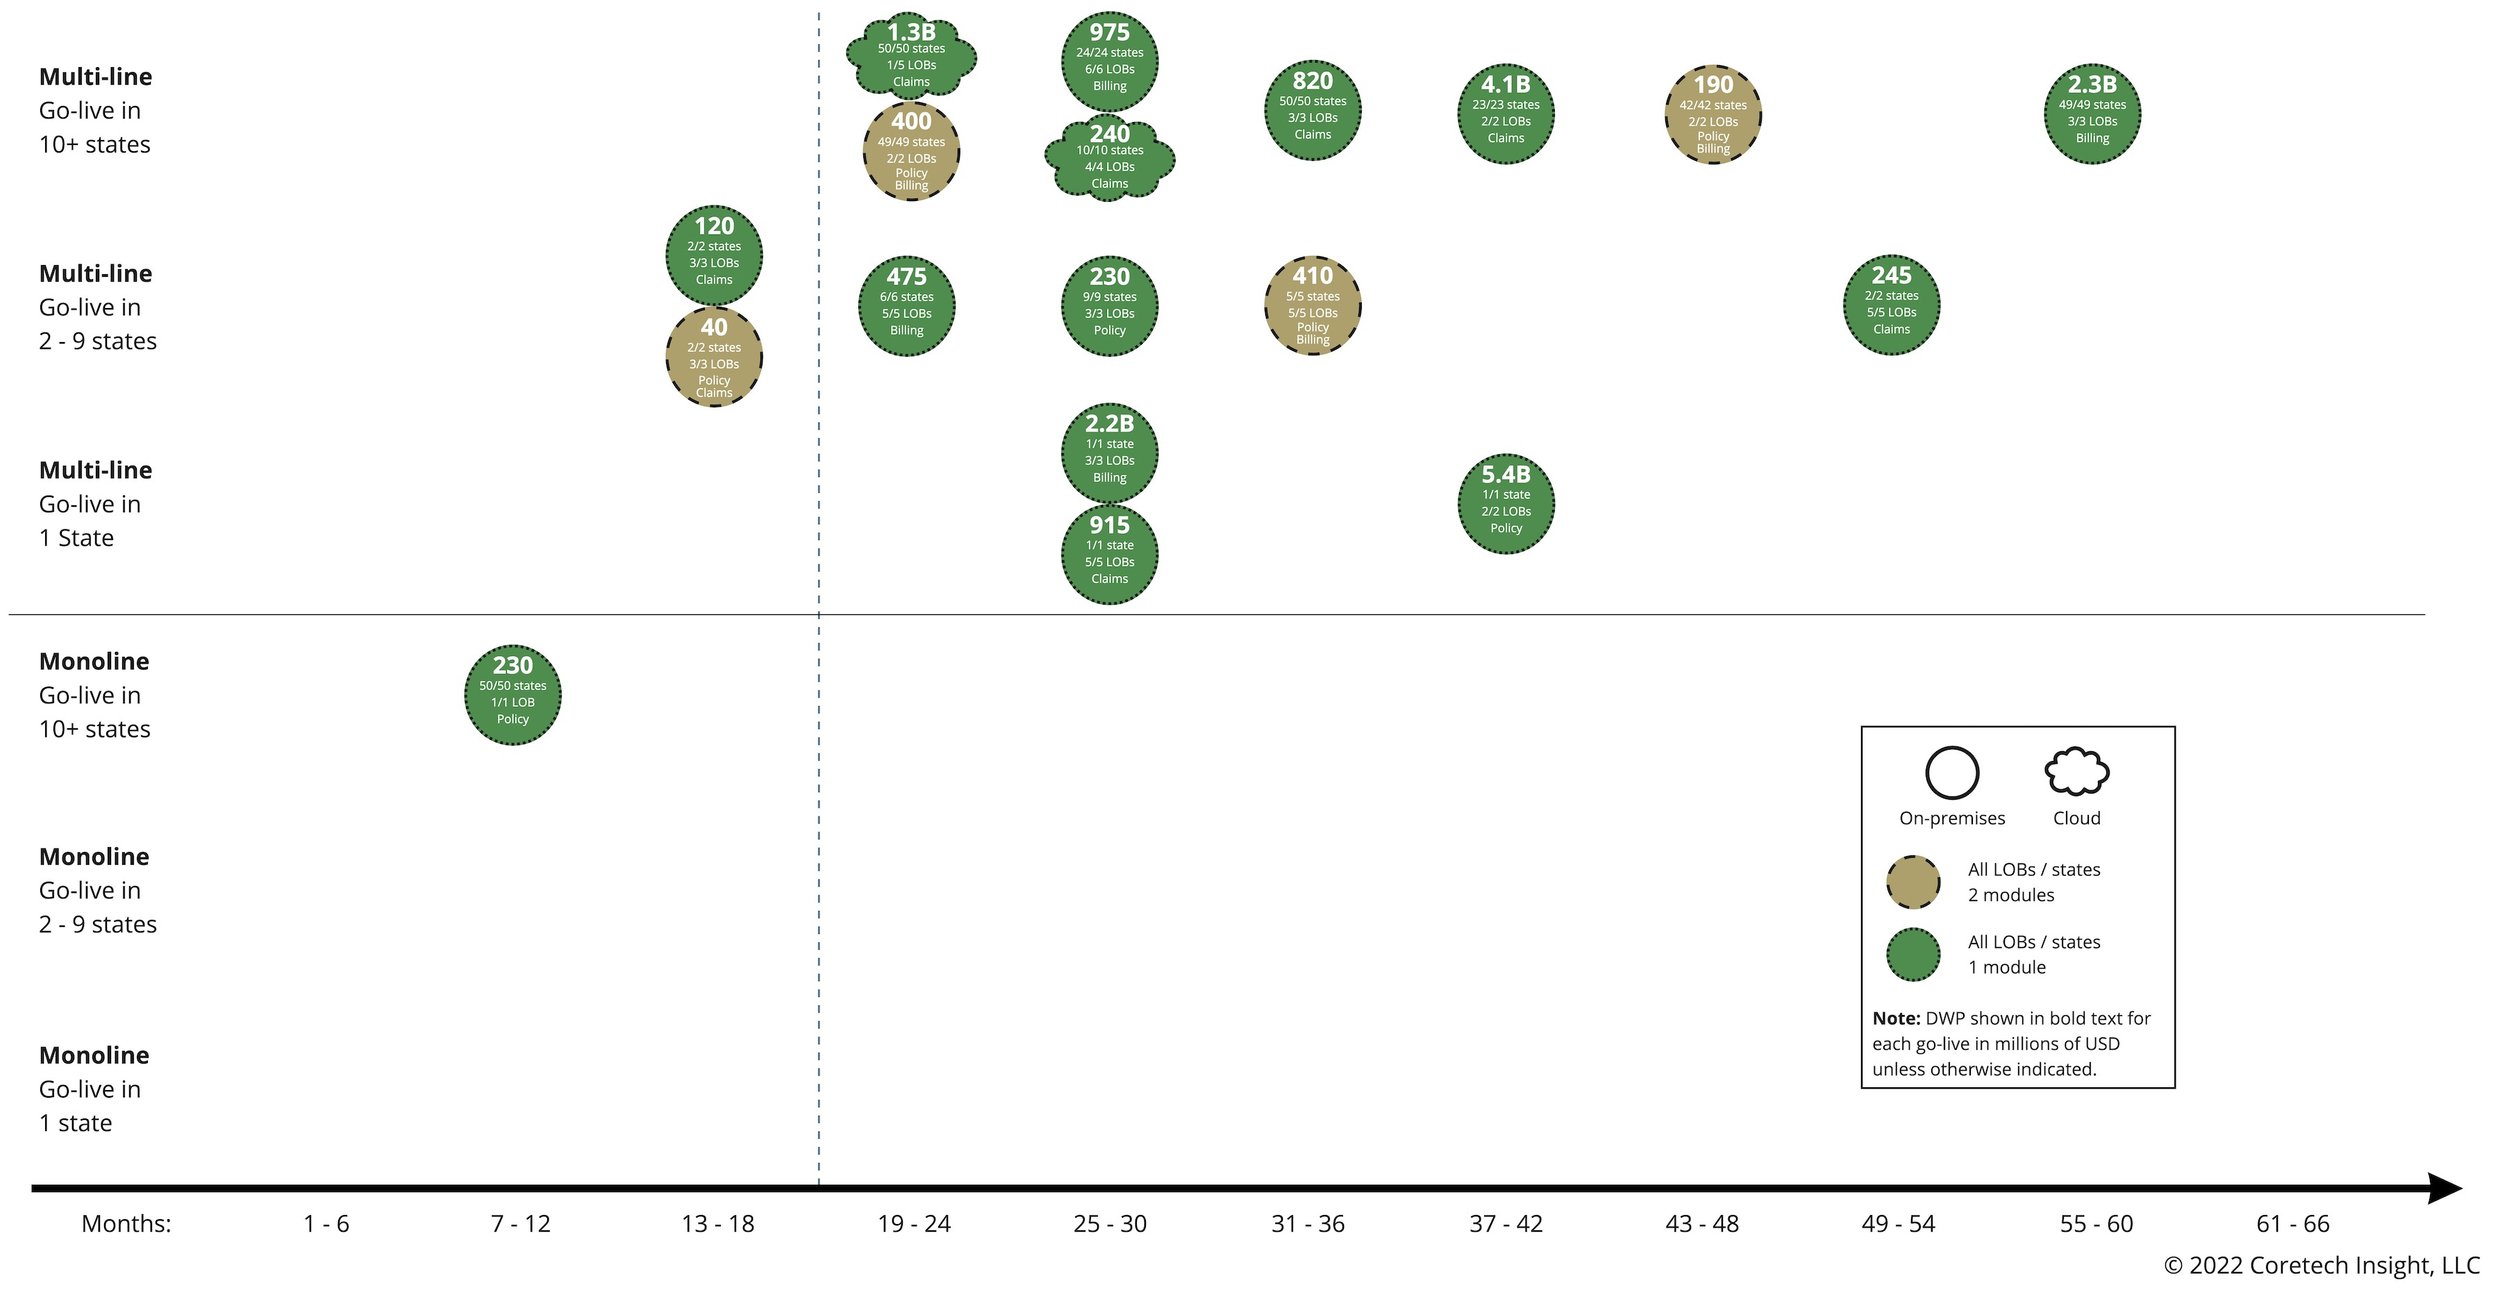
Eighteen insurers used Implementation Pattern 3. (See Figure 3 – Go-Lives with All LOBs, All States, and Some Modules.) Their go-lives included all of their LOBs across all states, but with only one or two core modules.
Figure 3. Go-Lives with All LOBs, All States, and Some Modules
Source: Coretech Insight, June 2022
(Click image for a downloadable PDF)
Although a few deployed two core modules, the most common approach for Pattern 3 insurers was to deploy a single core module across all LOBs and states. Average duration from selection to go live was 30 months. Overall, these were larger insurers with an average DWP of $1.1B. Three insurers (all under $250M DWP) were able to go-live with their selected module in under 18 months.
Implementation Pattern 4
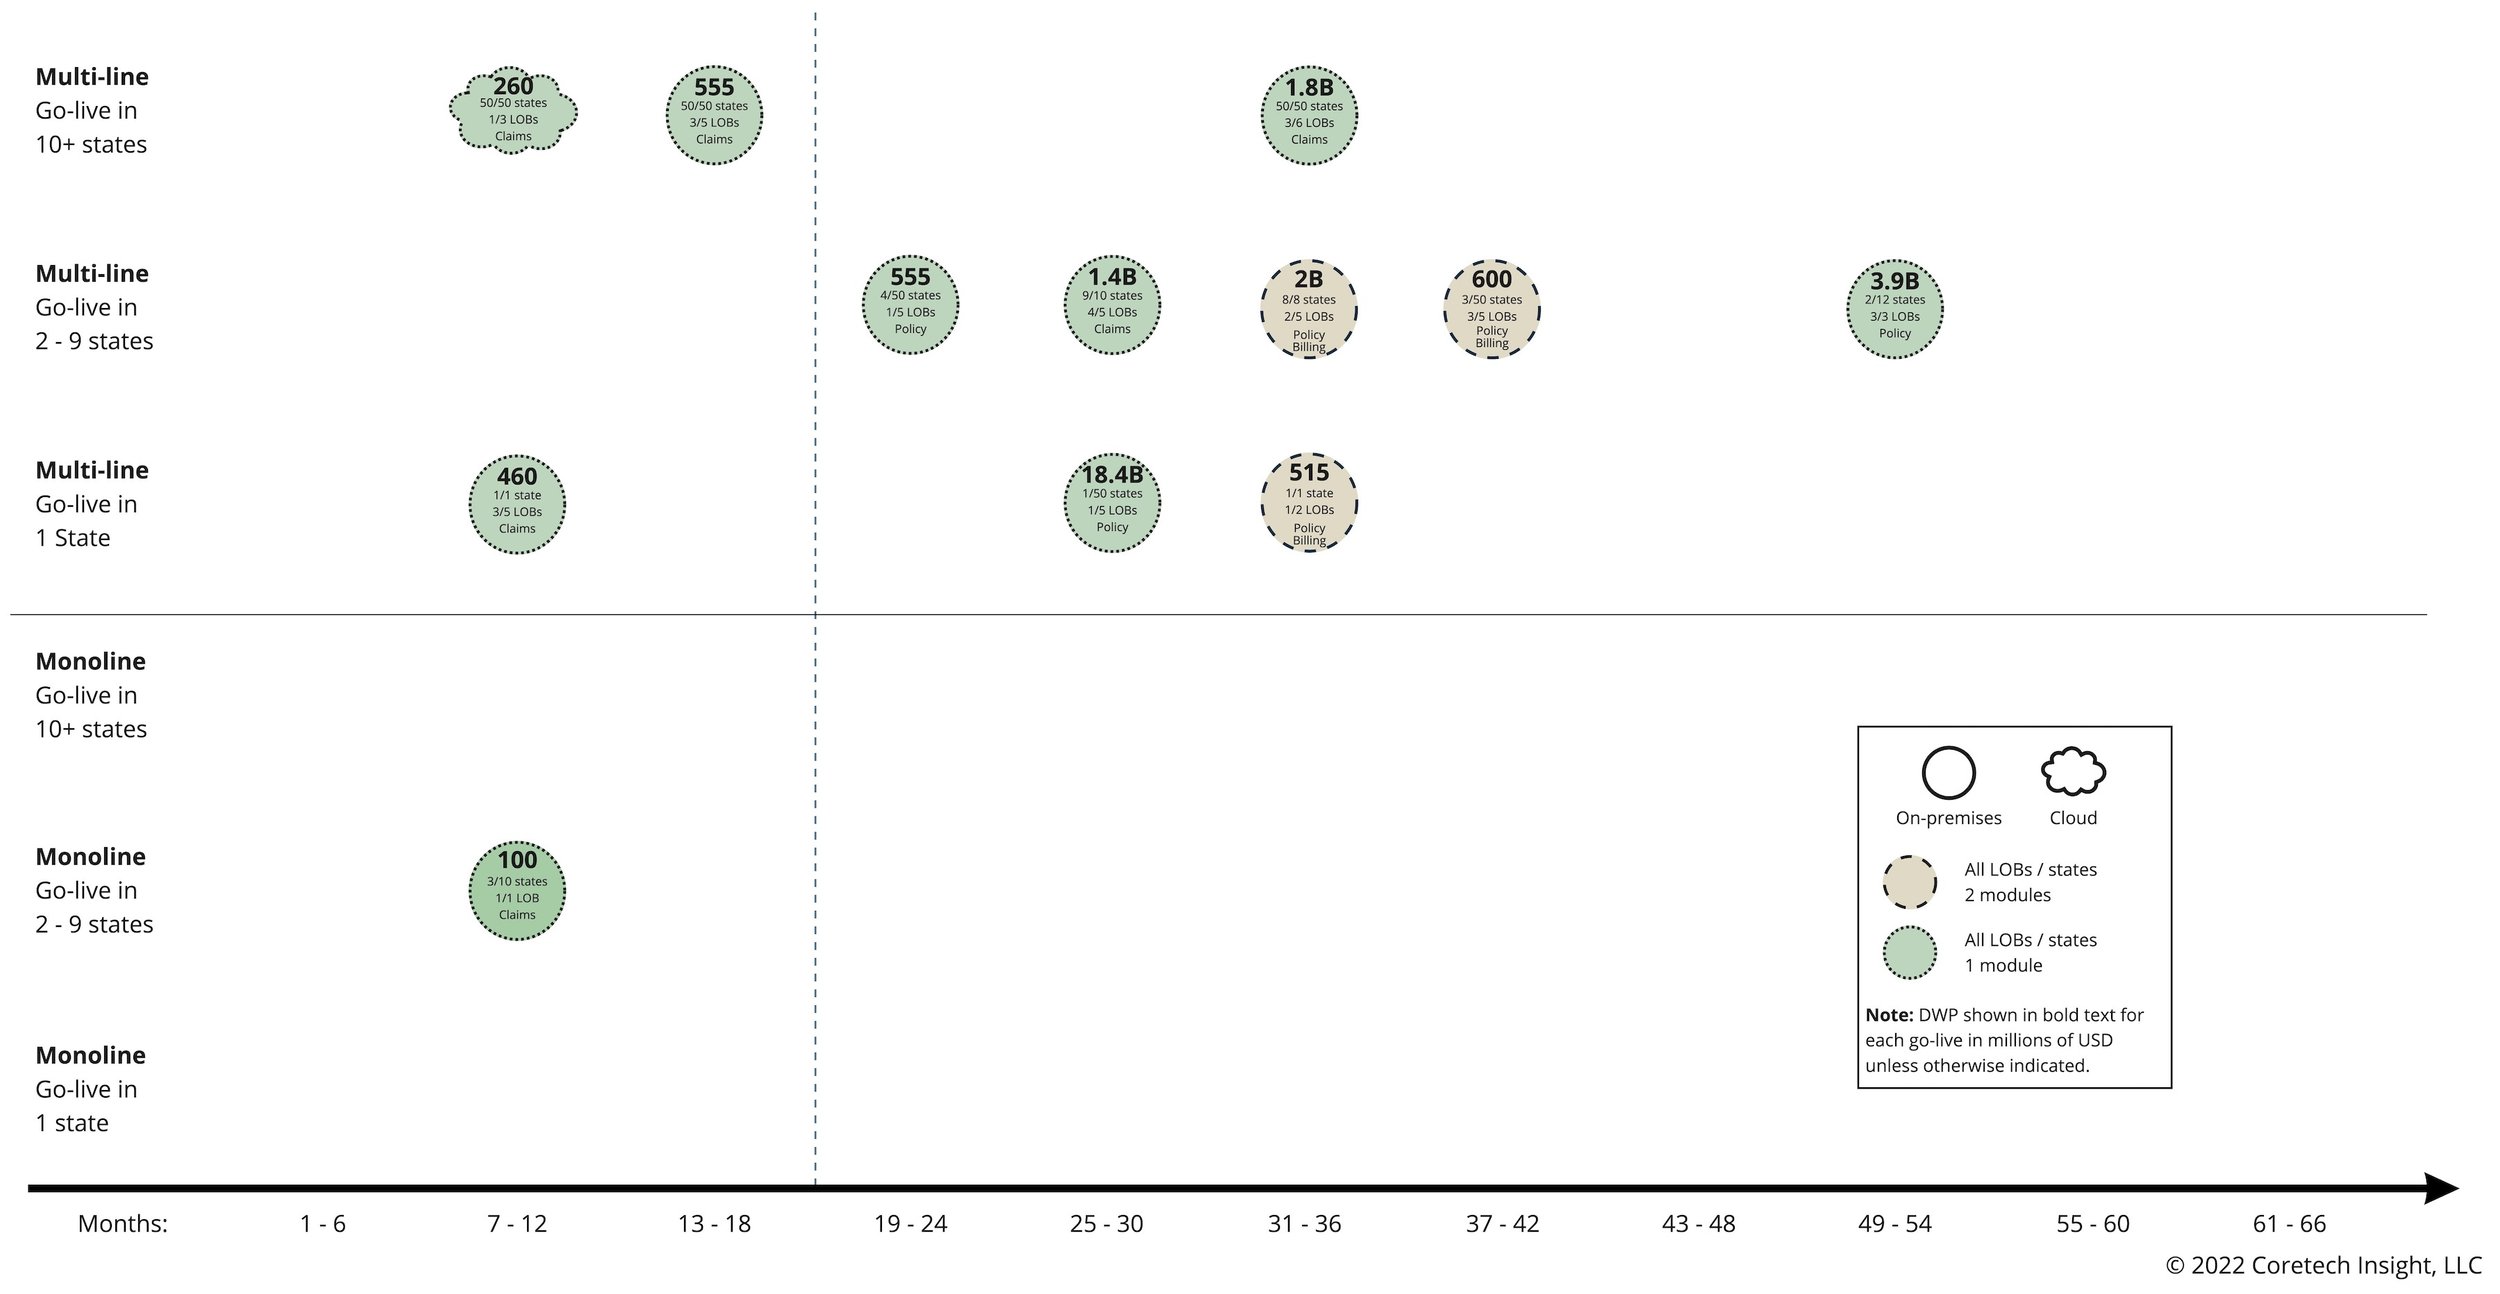
The remaining 12 insurers used Implementation Pattern 4. (See Figure 4 – Go Lives with Some Modules and Some LOBs and States.) These insurers reduced scope across the board – deploying only one or two modules across a subset of their LOBs and/or states.
Figure 4 – Go Lives with Some Modules and Some LOBs and States
Source: Coretech Insight, June 2022
(Click image for a downloadable PDF)
Most of the Pattern 4 insurers (9 out of 12) chose to deploy a single module with some LOBs and/or states. These were larger insurers, with an average DWP of $2.5B. Average time to initial go-live was 25 months. Four insurers (all under $600M DWP) were able to go-live in 18 months or less.
Why not just follow Pattern 1 from the start and get it all done?
These examples show how, by employing different approaches for managing scope, larger insurers were able to have an initial go-live with their new systems with an average duration similar to Pattern 1 — around the 24-month mark.
We also looked at likely results if the insurers hadn’t taken these alternative approaches. After all, reducing scope to hit a shorter timeline usually means there is still more work to be done later. What if these Pattern 2, 3, and 4 insurers had all tried to use Pattern 1 – all modules, all LOBs, across all states?
To address this question, we developed a rough formula for calculating duration from selection to go-live that incorporates key factors such as:
Overall size of the insurer (DWP)
Number of core modules and difficulty for each type
Number of LOBs/LOB categories (e.g. Home, Personal Auto, Commercial Auto, Commercial Lines, etc.)
Complexity of each LOB/LOB category
Number of states
This formula provides a helpful (albeit imprecise) guide for estimating implementation timeframes. As a thought experiment, we’ve applied this formula to estimate total duration as if all 61 insurers had used Pattern 1 – All modules, LOBs, and states. (See Table 2. Actual vs. Projected Pattern 1 Duration.) Our projections show a dramatic increase in average durations had all insurers attempted to use Pattern 1.
Table 2. Actual vs. Projected Pattern 1 Duration

Source: Coretech Insight, June 2022
It may seem obvious that a large, complex insurer should reduce scope and choose alternatives to Pattern 1, full deployment. However, it is not uncommon for stakeholders to express, “We’d rather wait until everything is done than use something that’s half-finished.” With core systems, waiting until all modules, all LOBs, and all states are “done” can work for insurance companies with certain profiles – the ideal profile being a small, monoline insurer operating in one state. As size, complexity, number of LOBs, and number of states increase, the picture changes. (See Figure 5. Projected Timeframes for Pattern 1 Go-Lives.) For many larger insurers, waiting until everything is done (all modules, all LOBs, and all states) before going live will mean waiting a long, long time! These finding help quantity the impact of trying to go live with too much in scope.
Also, it’s worth noting that when we applied our formula to the 18 insurers who actually followed Pattern 1, our projected duration of 19 months was 21% lower than their actual average duration of 24 months. This suggests that our other projections in Table 1 are lower than what actual timelines would be. Waiting for everything to be done would likely take even longer than what we show here.
Figure 5. Projected Timeframes for Pattern 1 Go-Lives
Source: Coretech Insight, June 2022
(Click image for a downloadable PDF)
Key Takeaways
A core system is one of the largest investments insurance leaders will make. A new core system does not provide business value until an insurer begins to use it in production. It’s imperative to reach go-live and begin to use new core systems in production as quickly as possible — even if this is a “partial” deployment.
Attempting to finish everything and go-live in one pass — all core modules, all LOBs, across all states – can be done, but this is best-suited for smaller or monoline insurers. It’s not ideal for most larger companies with multiple LOBs across many states. The scope will be too large and the insurer will have to wait too long — potentially many years — before everything is done and business value can finally begin to be realized.
Most companies should choose to divide their core system implementation up into manageable “chunks” so that time to each go-live is under 24 months. (Ideally, well under 24 months.) It may take a few years for larger insurers to finish everything, but they will benefit from breaking their implementation up into partial deployments. They will begin to see a return on their core system investment sooner through actual use. Experience gained from use of the new system in production is invaluable. This production experience will help eliminate guesswork about actual use of the new system, and will help their implementation teams make better, more informed decisions. This should accelerate progress with follow-on deployments.
Use these findings as a reference for setting an appropriate scope for your deployments. If your organization is smaller with narrower scope — for example, only a few LOBs and a few states — you have an ideal profile for a full deployment and may be able to move everything — all modules, LOBs, and states — into production with your first go-live. If your organization is larger and more complex, look to the implementation patterns above to keep scope manageable and reach your initial go-live (and begin realizing business value) faster.
And remember, no one is ever really “done” with modernizing and enhancing their core systems — even those Pattern 1 insurers who have gone live with all modules and LOBs across all states. Each go-live is just another milestone achieved and a new opportunity to ask , “What’s next?”
Customer history is a key indicator of a vendor’s future success
A vendor that has successfully worked with insurers like you is far more likely to be a successful partner.
In preparing these findings, we’ve mapped relationships and vendor/client histories
for over three dozen vendors and over 600 P&C insurance customers in the US and Canada.
Wondering which customers
a vendor has actually worked with?
How many insurers like you
have they (successfully) served?
Click the button below to reach out via email, or call us at +1 (908) 391-0950.
We’re ready to listen, compare notes, and help you find the vendor with the track record and capabilities that are the best fit for your needs.